 |
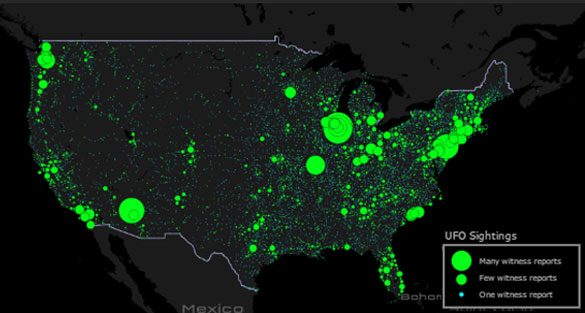
| A screenshot of the interactive map. Click the image to go to the interactive version. (Credit: Max Galka/Metrocosm.com) |
A data scientist has analyzed UFO sightings dating back to 1905, with a particular interest in mass sightings. He has come up with some fascinating information.
Max Galka is a New Yorker that says he is fascinated with data. He runs the website Metrocosm.com. He writes, “Metrocosm is an exploration of urban life through the lens of statistics, data, and quantitative visualization.”
His latest examination is of UFO sightings. Galka created a very detailed interactive map with sightings that go back to 1905. The data comes from the National UFO Reporting Center (NUFORC).
The map allows viewers to zoom into their area and click on UFO sighting events to get more detail. Some of the details come from another UFO sighting reporting organization, the Mutual UFO Network (MUFON).
Playing with the map can easily take up the rest of your day, and now that some of you have the link, your day may be shot. However, another interesting thing Galka did was to look at the incidents that garnered the highest number of UFO reports.
Here is his list of the top 10:
- Tinley Park Lights, Tinley Park, IL (10/2004) – 77 reports
- Cone of Light, East Coast (9/2009) – 75 reports
- Tinley Park Lights, Tinley Park, IL (10/2005) – 72 reports
- Phoenix Lights, Phoenix, AZ (3/1997) – 65 reports
- Blue-Green Fireball, the Midwest (7/1997) – 63 reports
- Tinley Park Lights, Tinley Park, IL (8/2004) – 45 reports
- Blue-Green Fireball, the Midwest (11/1999) – 43 reports
- Washington Fireball, Renton, WA (7/2012) – 40 reports
- Rockford Lights, Rockford, IL (1/2001) – 25 reports
- Lights Over NJ Turnpike, Carteret, NJ (7/2001) – 25 reports
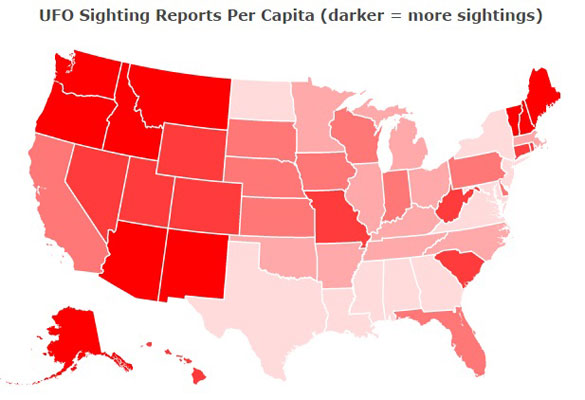
A
screenshot of the UFO sightings per capita map. Click the image to see
the interactive version. (Credit: Max Galka/Metrocosm.com)
In his article on the UFO data, Galka speculates that perhaps there are more UFO sightings around busy airports. Tinley Park is near Chicago, and Chicago’s O’Hare airport is one of the busiest airports in the country. He put together a map to show UFO sightings in relation to the five busiest airports.
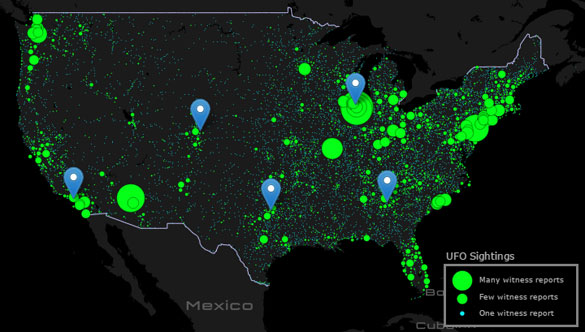
Map of UFO sightings near the 5 busiest airports in the United States. (Credit: Max Galka/Metrocosm.com)
Of course it could be that people also often mistake fireworks for UFOs.
Read Galka’s Metrocosm blog for more of his analysis and to play with his great interactive maps.
Alejandro Rojas
Source
No comments:
Post a Comment
Note: Only a member of this blog may post a comment.